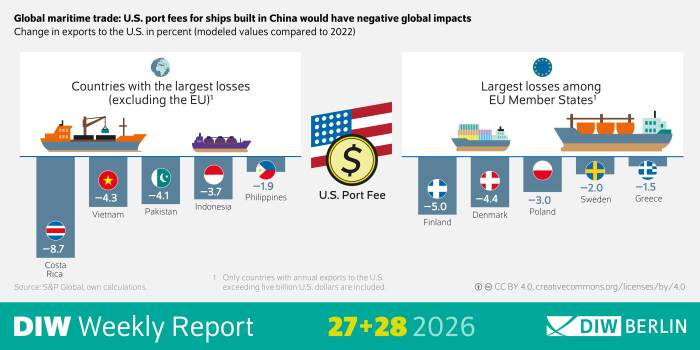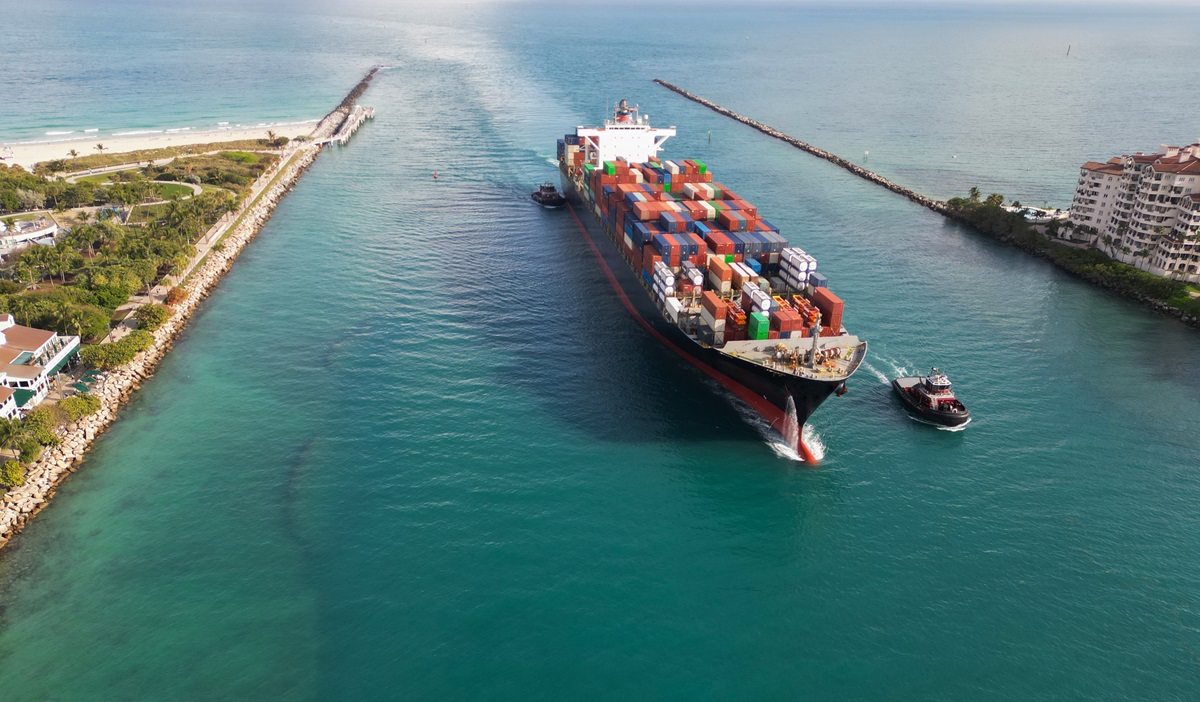
Shipbuilding and U.S. Trade Policy: Economic burden falls on the US rather than China
Read more
The ECB’s collateral policy supports financial markets and reduces uncertainty
read more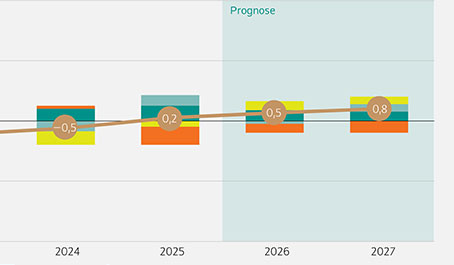
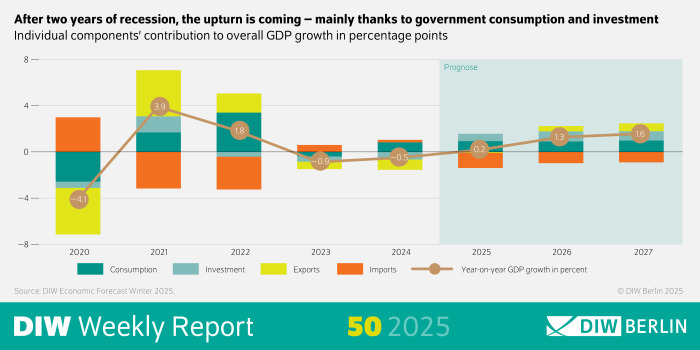
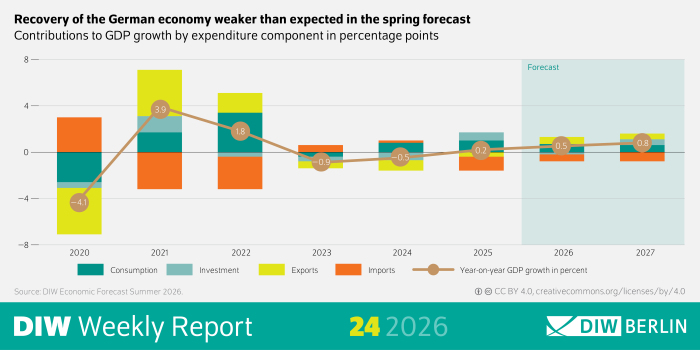
Energy price shock slows German economy - Global growth remains moderate
More here